Data tables are the beating heart of business and enterprise application dashboards, where users need to be able to quickly scan information to make quick and savvy decisions. At Moze, we have had significant experience with these tools, where managing huge amounts of data is a constant challenge for designers and users.
In this article, we will explore a vital aspect of UX design for data tables: their usability. Taking into consideration common user needs, from specific searches to data visualization, from editing to management, we will guide you to discover best practices and strategies for creating super-usable data tables.
Finding specific information
When users search for specific information in a data table, the design should make it easy to find and locate the desired information while minimizing the effort of learning the interface and its functionality.
When there is little information to display, such as in the case of a table listing the contacts of a small company, finding the data can be quite simple. In this case, the user can easily find the contacts he or she needs, without the need for advanced functionality.
In contrast, in the case of an e-commerce with a large assortment of products, it becomes much more difficult for users to find the information they are looking for. In this case, search, filters and sorting are essential features to help users find the specific information they need.
Here is a list of some design best practices for designing a data table in a way that makes it easier for users to find information:
Layout
The location of searching, filtering, and sorting in a data table is a critical aspect of ensuring the accessibility and usability of the interface. In order to position these elements effectively, it is important that they are clearly visible, not far apart, and preferably placed at the top of the table or at the top of the page.

Search
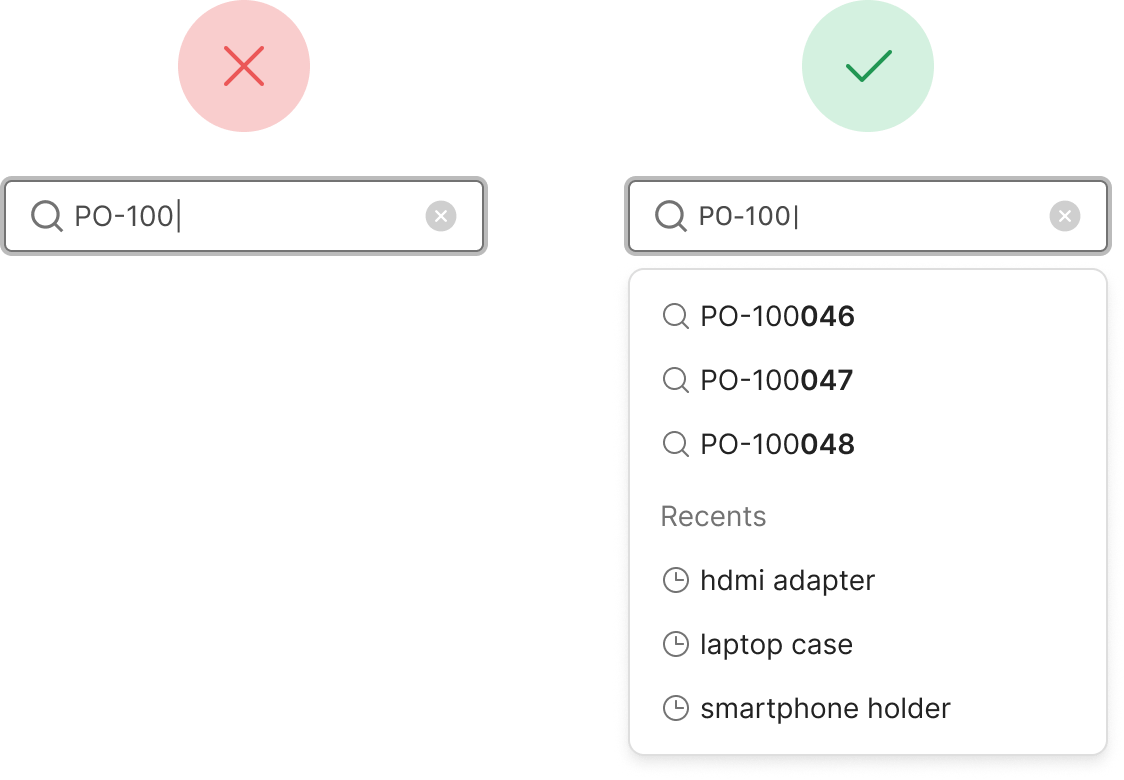
With regard to search, it is useful to provide suggestions and auto-completion to make it as easy as possible for the user, allow advanced search using filters, and provide clear visual feedback to signal the positive or negative outcome of the interaction.
Filters
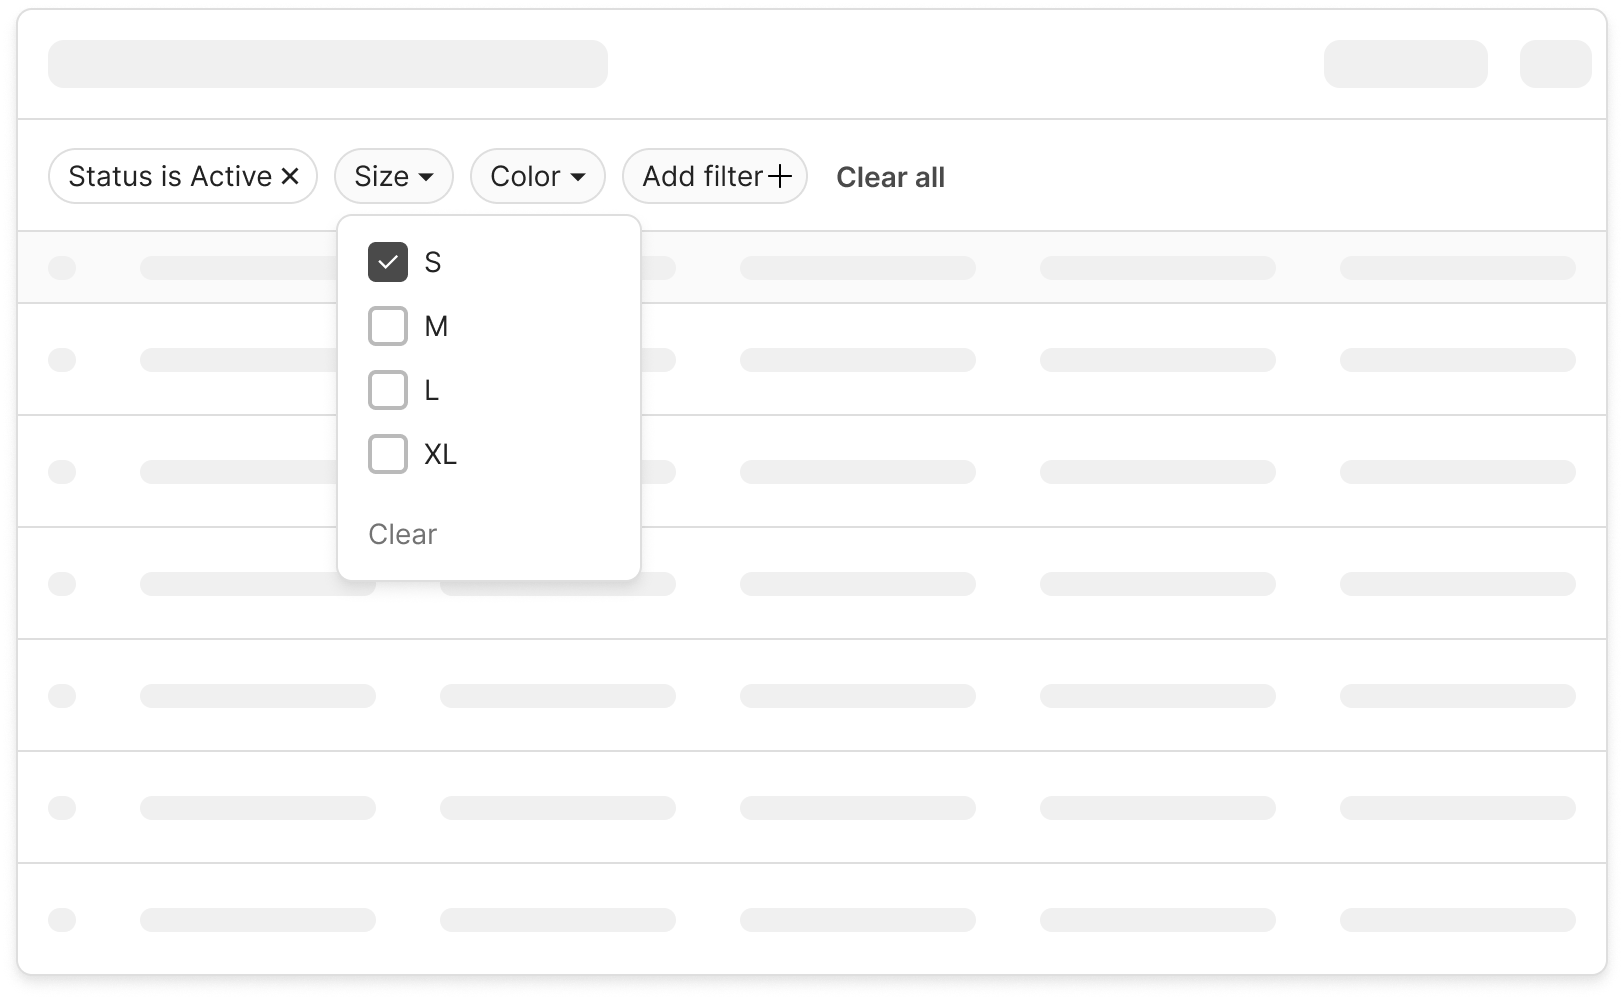
As for filters, it is advisable to organize them consistently with respect to the type of information displayed in the table, using clear icons and labels to indicate the type of filter and the parameters to be selected, avoiding providing too many options so as not to confuse the user. Again, it is important to provide visual feedback to signal the application or removal of filters.
Sorting
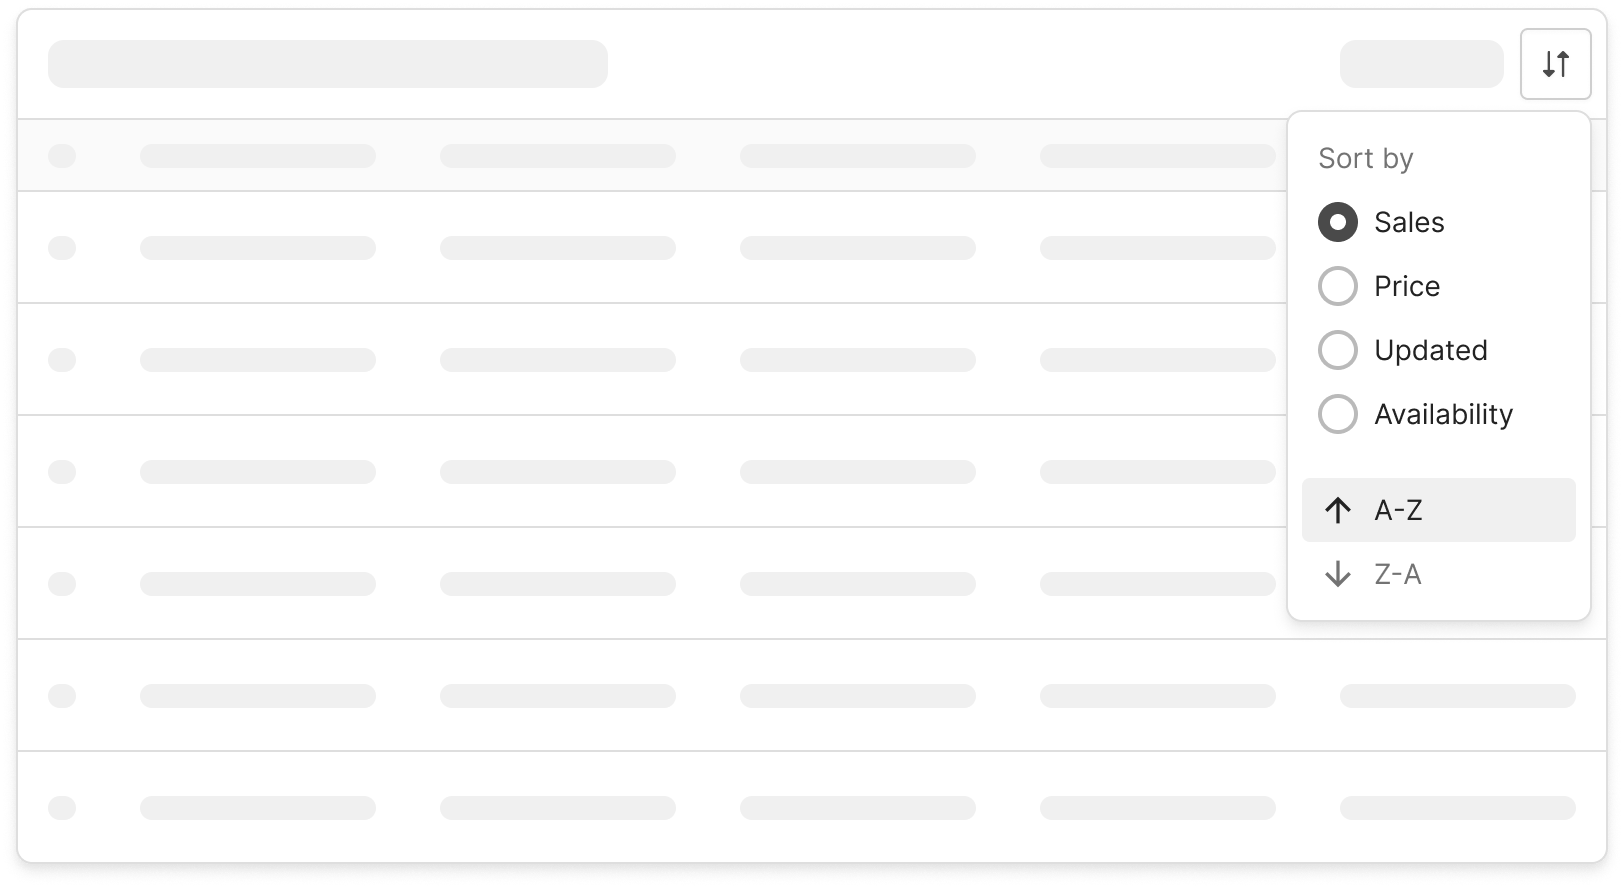
Finally, providing predefined data sorting can help users view information consistently and logically from the start. For example, a table of products might be sorted initially by price within the sales section or by product popularity in marketing campaigns.
It is also useful to use icons, such as arrows indicating ascending or descending order, to help users understand the way the data is sorted.
In cases where there are many sorting options available (e.g., alphabetical order, chronological order, numerical order), it is important to explain how each option works and indicate which is best for different users' needs.
Visualizing data
Simplifying the visual scanning of a data table is critical to the user experience because it goes a long way toward reducing cognitive load and improving reading of the information presented.
If the information is presented in a confusing or unclear manner, the user has to make more effort to decipher the data, which can lead to increased stress and mental fatigue.
Therefore, it is important to design tables in such a way that the data are easily identifiable and organized according to the users' language and needs, rather than according to the designer's logic or application development needs.
Below are some key points for designing a table that is easy to read and interpret:
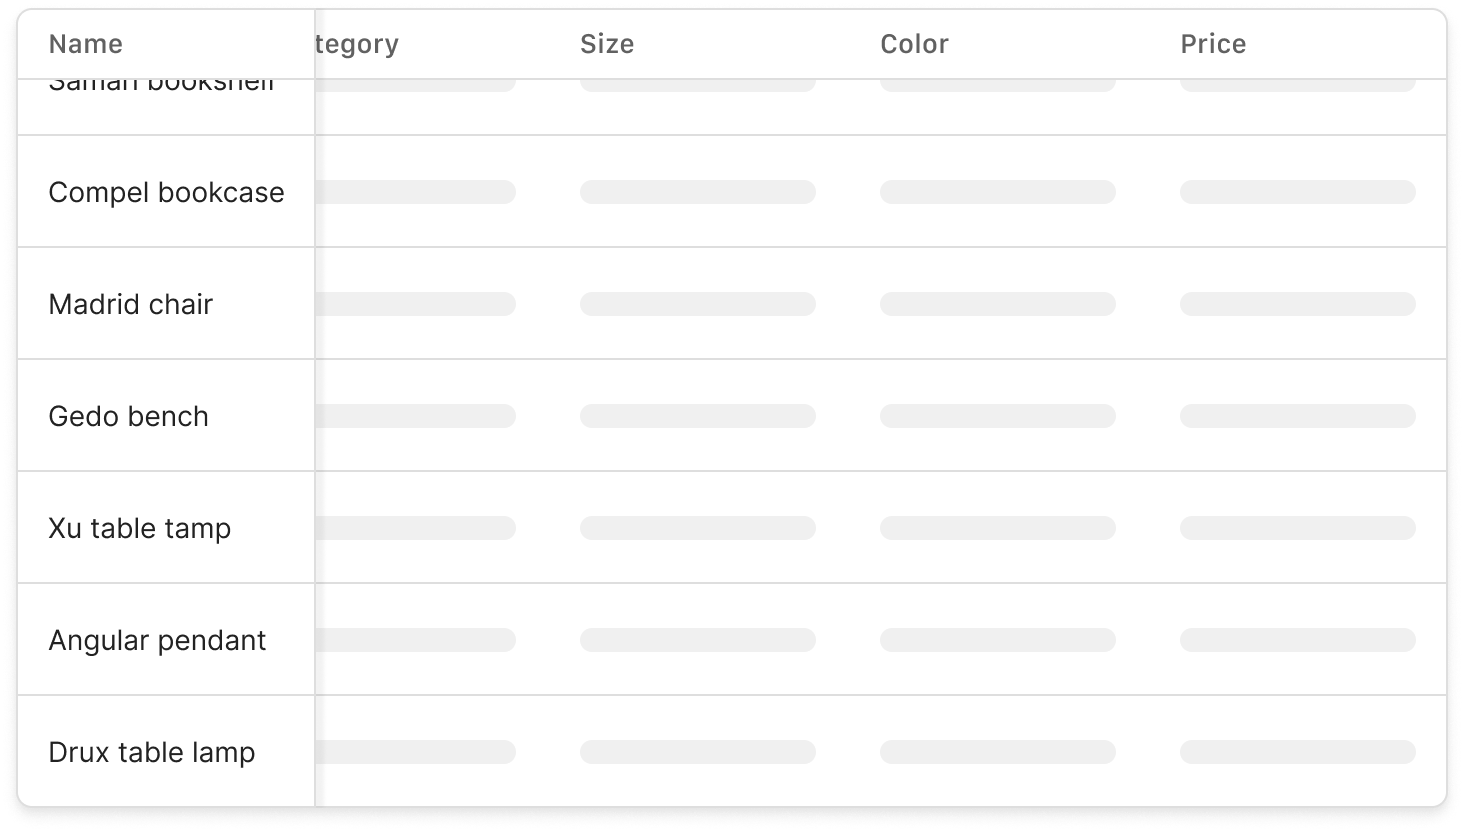
Keep header row and column fixed
Keeping the header rows and columns fixed, even when scrolling down the table, is important to keep track of information in a clear and organized way. This way, users can always know to which column or row a particular piece of data belongs.
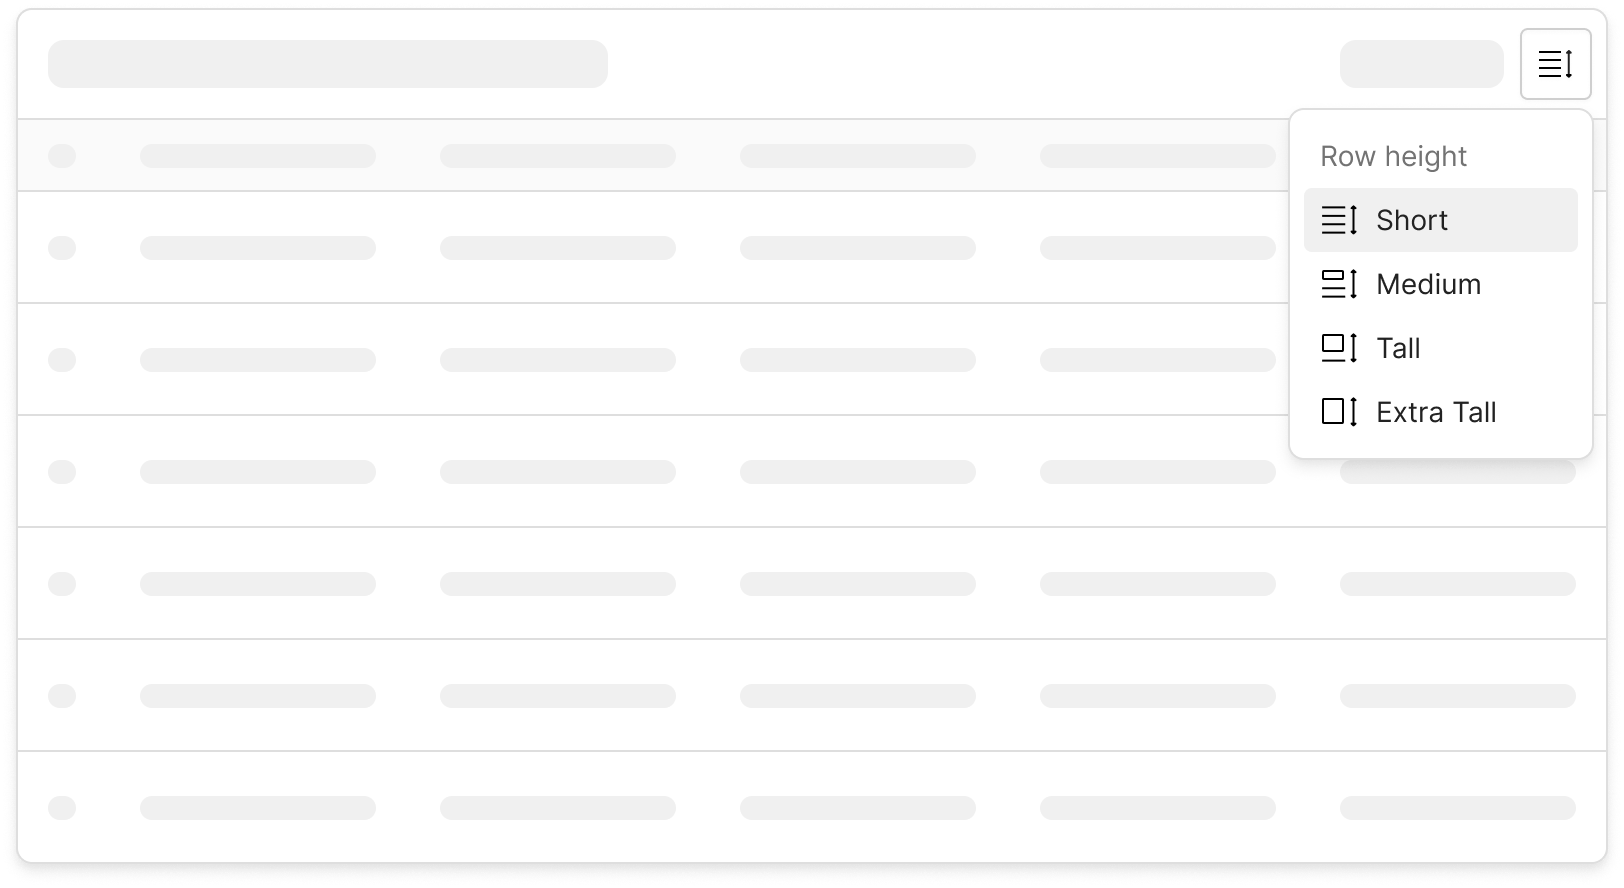
Changing the row density
Changing the row density, based on the amount of information contained in each row, can help make the table easier to read. For example, using thicker rows to separate data can help distinguish information in the table. Conversely, using thinner rows can help increase the amount of data visible in a single screen.
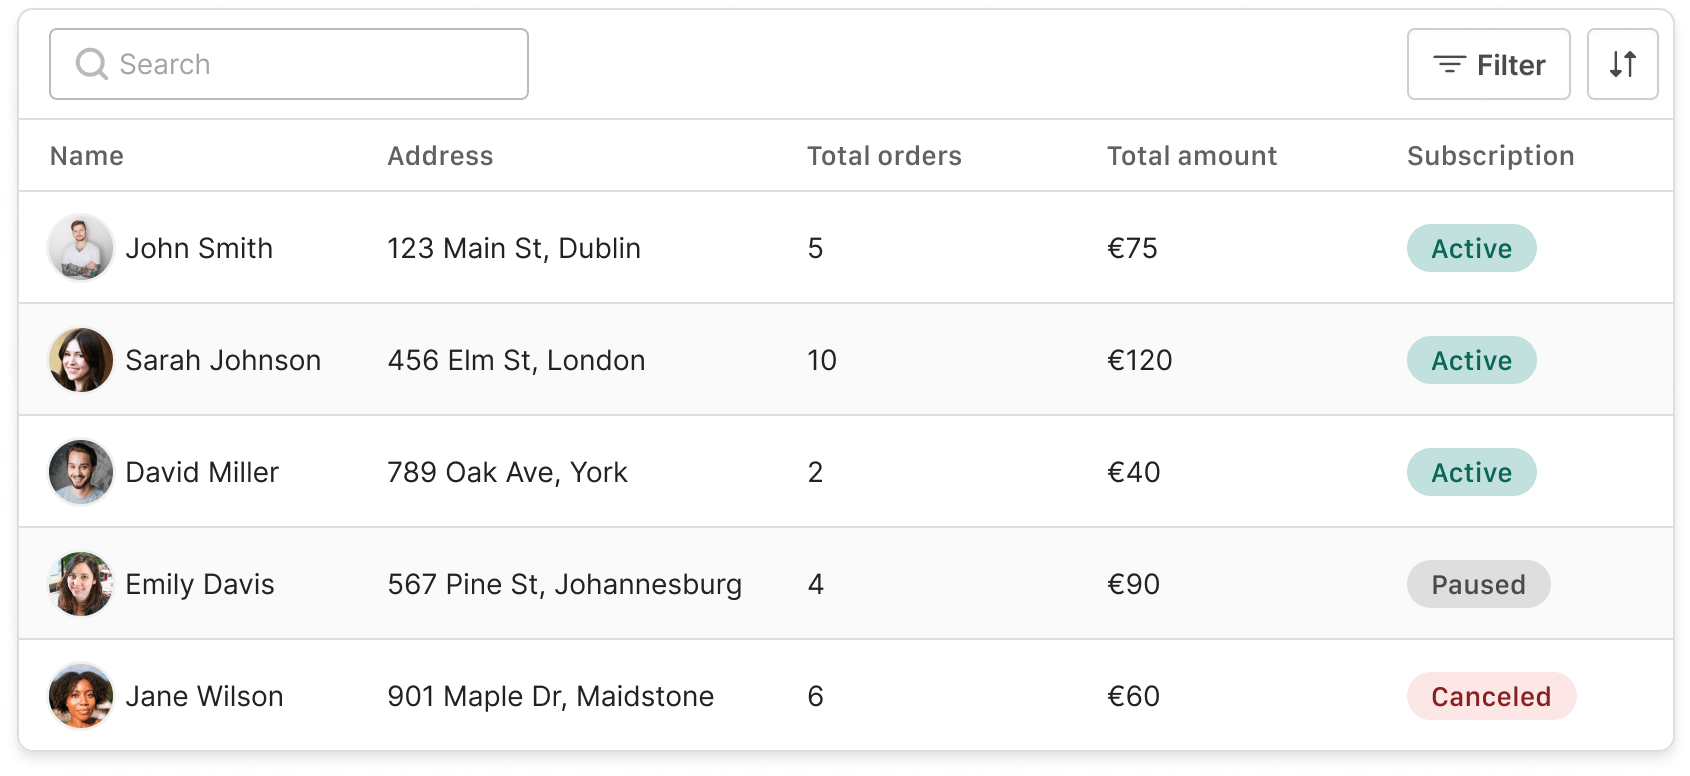
Use a clear visual style
Carefully designing the graphic style is one of the best strategies to make it easier to scan a data table. For example, alternating rows of color can be used to improve readability. In addition, the use of colorful badges or icons can help differentiate information, allowing it to be read more clearly and easily.
However, it is important not to overdo it; an excess of visual effects could make the data table confusing and difficult to read. In contrast, the main rule for graphic style in a data table is to maintain a balance between functionality and design, with the goal of maximally supporting ease of reading while maintaining useful and interesting aesthetics.
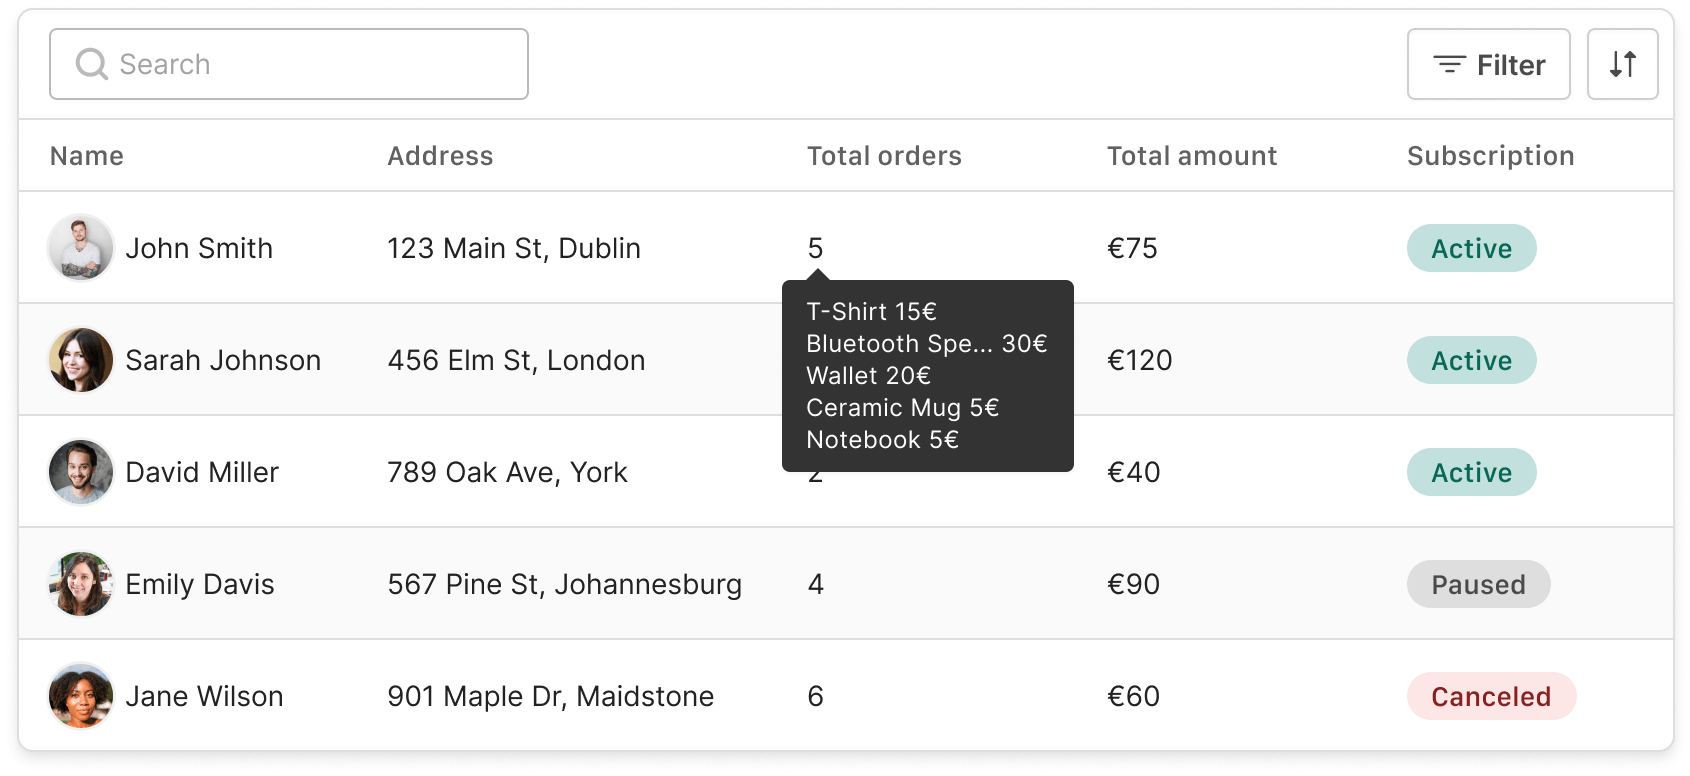
Enabling contextual exploration
Enabling contextual exploration allows users to view data in greater depth without having to leave the table screen. This reduces the overall interaction cost and makes the user experience smoother.
There are several ways to enable data exploration, such as a tooltip, modal window, sidebar, or accordion. All of these enable a value or row data to be shown quickly and effectively.
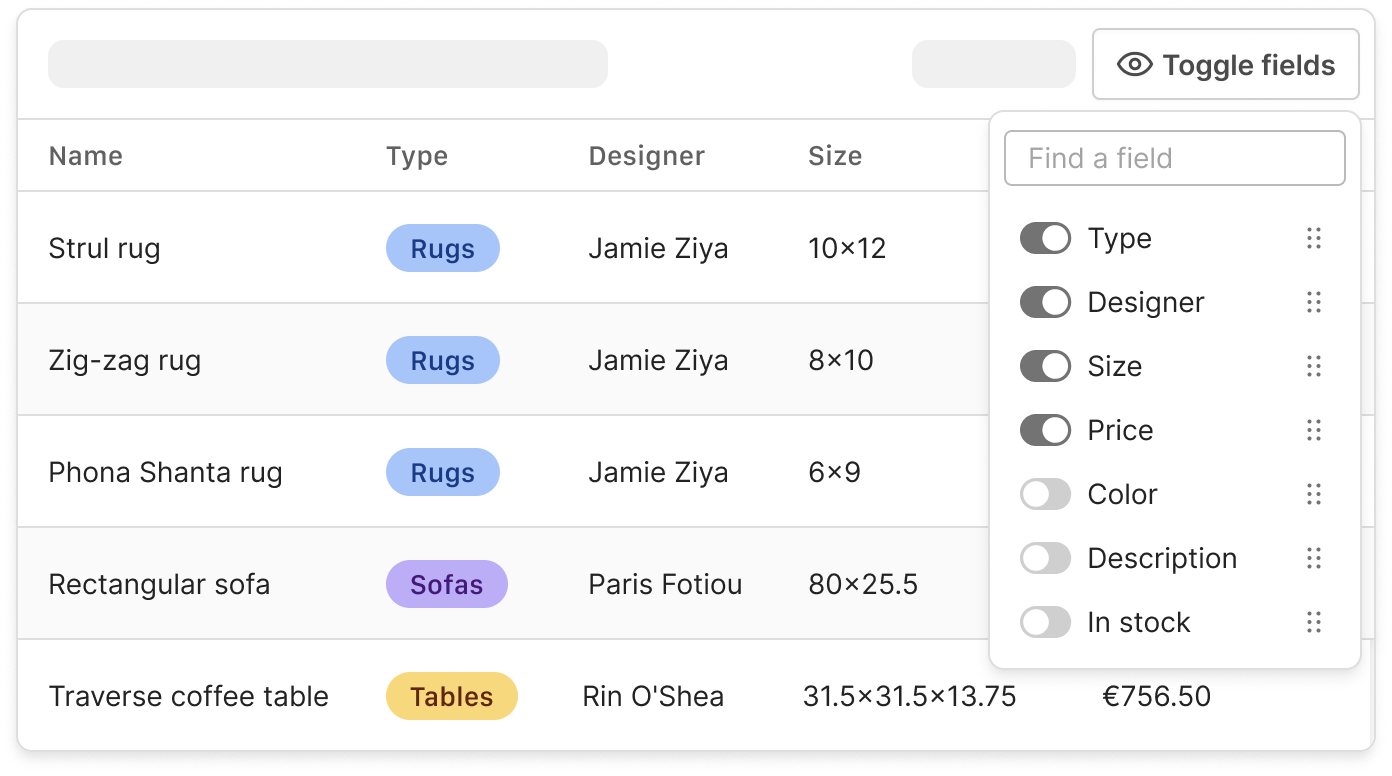
Tiling data for comparison
Data tiling is a crucial feature for data comparison, especially in the case of very large tables. Through the ability to show, hide, and reorder rows and columns, comparisons can be made between information in a table, making it easier to understand the data and helping the user make informed decisions.
Editing and managing data
Finally, when working with large amounts of data in a table, it is essential to allow the user to edit and manage the data contextually, without having to switch screens.
Here are three essential ways to implement this:
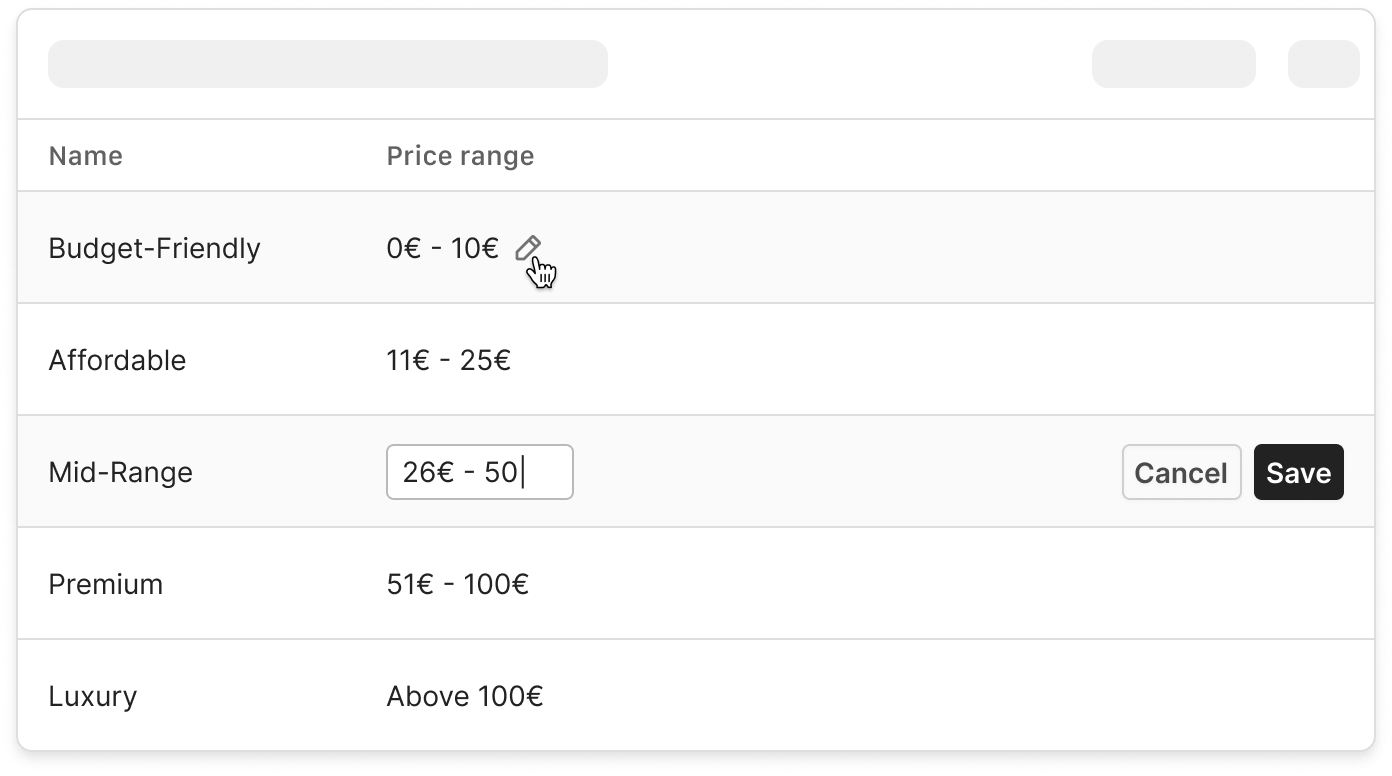
Editing a single value
This is the most common type of modification you make in a table. You can edit a single value by selecting the cell or field containing the data you want to change and typing in the new value. It may be useful, depending on the impact each change has on the system, to provide explicit action buttons to initiate, confirm, or cancel the change.
For example, in the case of an e-commerce site, changing the selling price of a product has a great impact on the system, since it affects the turnover. In contrast, changing less critical values, such as the icon of a product category, has less impact on the system and can be done quickly and easily.
Editing an entire row
Single-row editing actions should be few and conspicuous, using recognizable icons for common actions such as editing, deleting, and adding a new row.
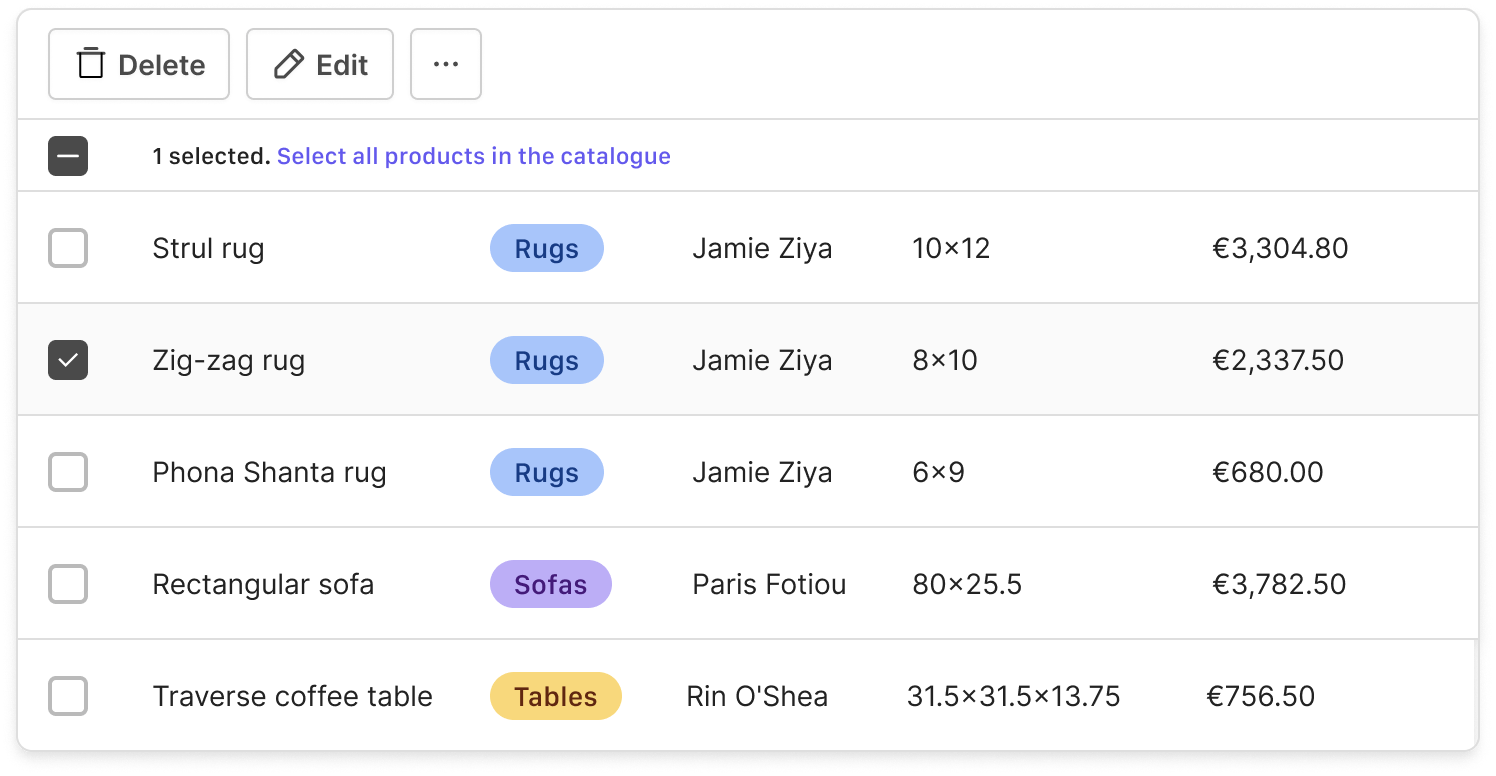
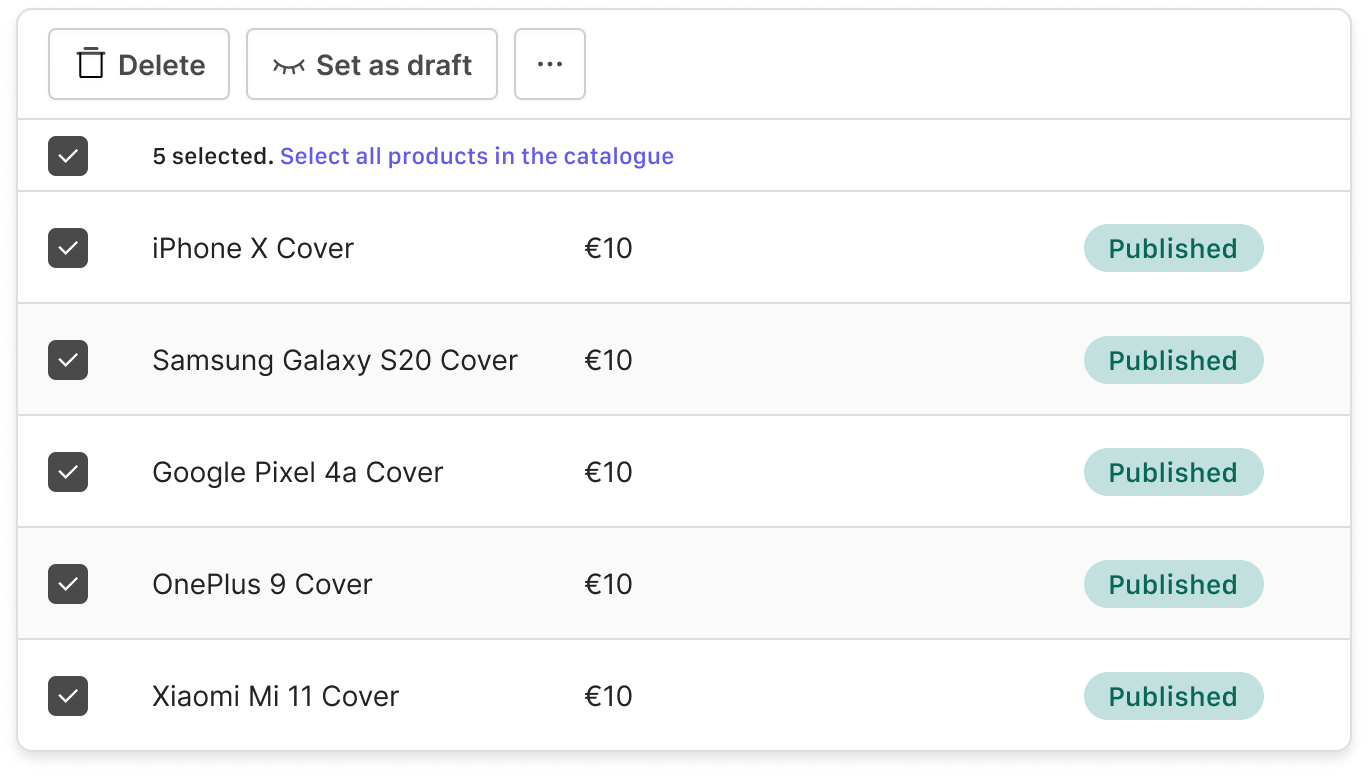
Modifying rows in bulk
When working with large amounts of data, you often want to make the same change on several rows at once. For example, you might want to change the visibility of a number of products from an ecommerce site's catalog in one fell swoop. This can be done by selecting all relevant rows and changing the visibility at once. This feature saves time and avoids having to perform the same operation repeatedly on each individual row.
Test the table with users
In conclusion, designing usable data tables for business and enterprise interfaces requires a holistic approach based on the primary needs of users. In this context, engaging users with User Research is a critical element in ensuring the effectiveness and usability of the data table.
Through User Research, valuable information can be gathered about the perception and use of the data table, identifying any issues and developing effective solutions to improve the user experience.
It is important to involve users in the design phase of the data table at an early stage to ensure that the design meets their needs and expectations. Testing can be conducted in a variety of ways, such as through one-on-one interviews in which to observe user behavior and gather user feedback.
Designing iteratively, paying constant attention to users' needs, can require considerable energy and some organizational capacity, but it achieves valuable results.